Analytics
Turn data into decisive action
Unified dashboards, AI-powered insights, and automated reporting keep your operations ahead of the curve.
Strategic positioning
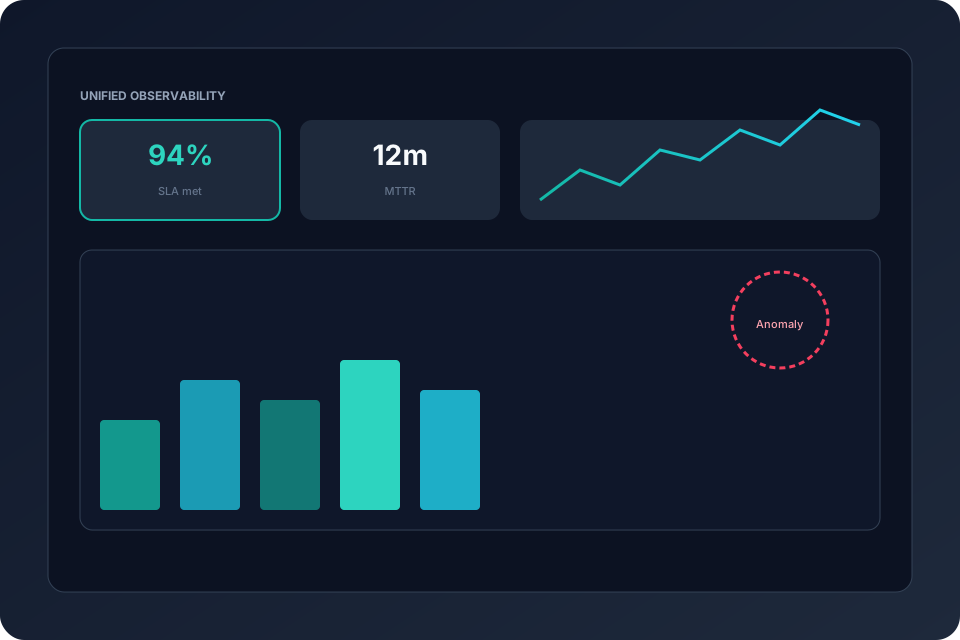
Orqit's Analytics is an enterprise-grade observability hub that unifies data, applies AI to surface actionable insights, and provides role-based dashboards for every stakeholder.
Who this is for
- Executives monitoring service health and cost efficiency
- Operations managers tracking SLA, MTTR, and asset utilization
- Product managers evaluating feature adoption and usage patterns
Operational pain points
-
Siloed metrics ITSM, Asset, and Workflow data live in disconnected views.
-
Manual reporting Analysts spend hours exporting and reconciling spreadsheets.
-
No predictive insight Teams react to incidents instead of anticipating capacity issues.
-
Weak business correlation Technical KPIs rarely tie to revenue or cost outcomes.
Execution-aware ITSM
See the full impact chain—not just the symptom
All platform events feed into a central data lake. Pre-built and custom dashboards let users visualize incident trends, asset health, workflow performance, and financial KPIs. AI models detect anomalies, forecast demand, and recommend corrective actions, all while maintaining strict data governance.
Capabilities
Platform capabilities
Enterprise-grade observability for executives, operations managers, and product leaders who need one source of truth.
Unified Data Lake
Normalized event store across ITSM, assets, workflows, and finance.
Role-Based Dashboards
Executive, ops, finance, and security views out of the box.
AI-Enhanced Insights
Anomaly detection and predictive SLA breach alerts.
Custom Reporting Engine
Schedule, export, and embed reports in your BI stack.
Governance Controls
Data residency, retention policies, and query audit logs.
Workflow examples
How incidents move through Orqit
-
1
SLA Forecast
AI predicts upcoming SLA breaches from incident inflow and alerts ops managers.
-
2
Asset Utilization Heatmap
Visualize under-utilized hardware and get consolidation recommendations.
-
3
Cost-to-Value Dashboard
Correlate feature usage with subscription revenue and margin.
-
4
Security Posture Score
Aggregate compliance findings and track trend over time.
Operational benefits
Outcomes your teams will feel
Less reporting toil
Cut manual reporting effort with scheduled, governed exports.
Faster detection
Surface performance regressions before they become outages.
Executive confidence
Real-time KPI visibility for board-ready conversations.
Data-driven ROI
Tie operational metrics to business outcomes.
Governance & security
Built for audit and least-privilege
- All analytics data is encrypted at rest and in transit.
- Role-based access controls ensure users see only permitted metrics.
- Audit trail captures every query and export action.
AI usage
Co-pilot within your guardrails
AI models analyze historical trends to forecast incidents, detect outliers, and generate natural-language insights for dashboards.
Analytics visibility
Operational dashboards that executives trust
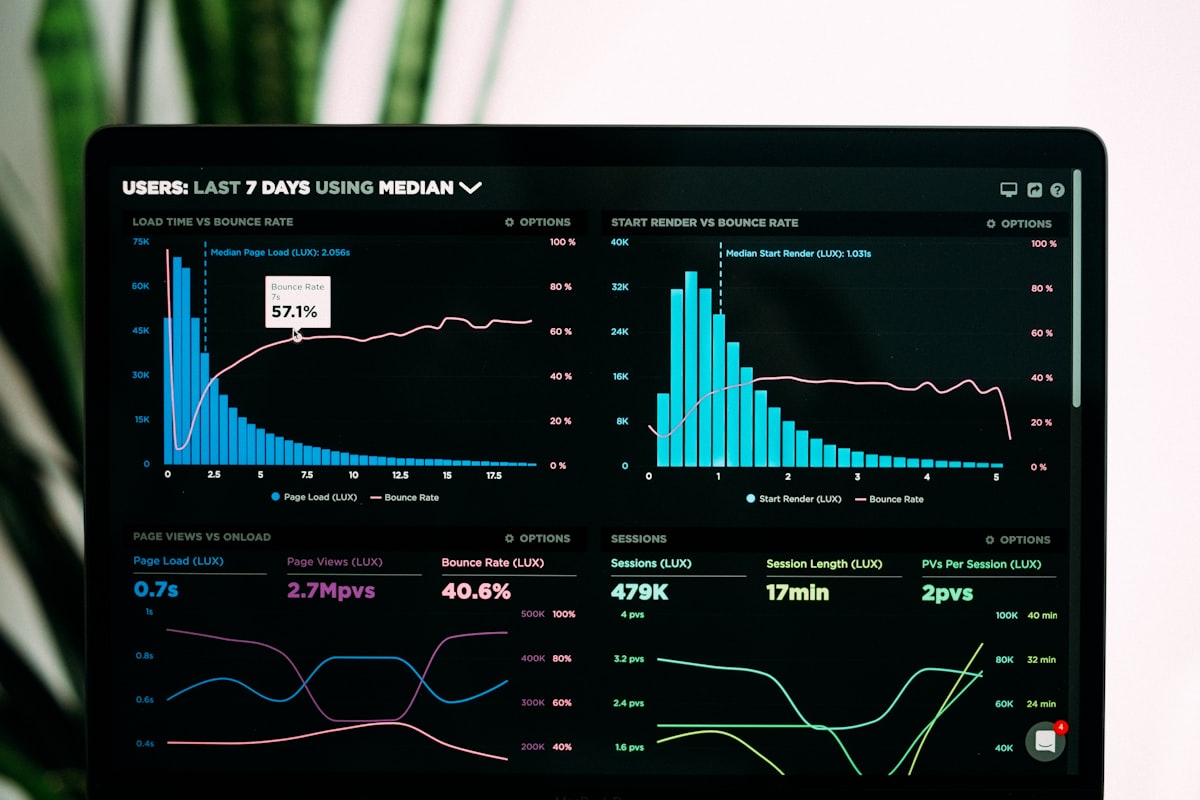
Pre-built dashboards for Incident Management, Asset Lifecycle, Workflow Efficiency, Financial Health, and Security Compliance.
Integrations
Connects to your stack
Tableau
Power BI
Splunk
 ServiceNow
FAQ
Common questions
Can I create custom dashboards?
Yes – the drag-and-drop builder lets you combine any data source.
How long is data retained?
Retention policies are configurable per compliance requirement (e.g., 90 days, 1 year).
Ready to modernize IT operations?
Launch a pilot workspace or book a walkthrough with our team.